For three years, OARnet has been implementing an open source software called perfSONAR (PERFormance Service Oriented Network ARchitecture). This statement frequently prompts the obvious question, “What is perfSONAR, and how is OARnet using it?”
perfSONAR – continuously developed by institutions such as ESnet, GEANT, Indiana University, and Internet2 – is a measurement software aimed at identifying soft failures in a network. Soft failures are an issue that may go undetected for more than a year because they cause no immediate issues. An example of a soft failure would be a slowly failing optic, while a hard failure would be something along the lines of a power supply failure or fiber cut.
OARnet is implementing perfSONAR nodes in the OARnet backbone, at the demarcation point of client networks, in Science DMZs and various external test points.
OARnet uses perfSONAR on a daily basis to monitor network latency (the time it takes a packet or piece of data to leave one device and travel to another, normally measured in milliseconds), bandwidth (the amount of data that can be transferred in a second, normally measured in Megabits per second or Gigabits per second), and packet loss (the amount of packets, or pieces of data that do not make it to their final destination) through scheduled, low-impact tests. In other words, OARnet is able to get valuable data while client sites see little to no network impact because of the testing. At the same time, OARnet implements the on-demand testing capabilities of perfSONAR to troubleshoot intermittent issues within the network.
OARnet has over 20 client-based nodes, two nodes in separate parts of the network that clients can test to at any time, a server and a complete testbed for the newest perfSONAR release. OARnet is also collaborating with five out-of-state partners such as Internet2, the University of Michigan, and the University of Minnesota to expand our testing area. To date, our clients have been pleased with the performance-monitoring statistics they’ve been able to extrapolate from the software. perfSONAR has even played a role in multiple institutions testing their own internal networks to make sure they’re up and running to the level their students, staff, and faculty expect.
With two commands, OARnet can get a thorough picture of a link’s bandwidth, latency, packet loss, and delay.Those commands are: owping (host IP address) – This command, short for One-Way Ping, conducts a series of ping tests to give back data on latency, jitter, and delay. A typical output is pictured below.
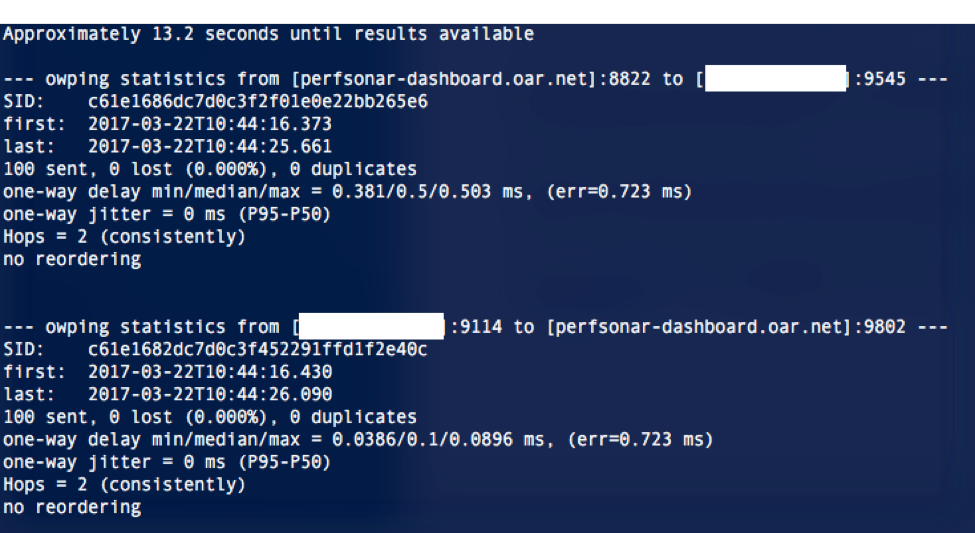
Here you can see that we were able to achieve zero lost packets, jitter, and minimal latency.
bwctl –T iperf3 –f m –t 10 –I 1 –c (host IP address) – This command, short for Bandwidth Test Controller, allows us to run a low-impact bandwidth test against another host that has iPerf3 capabilities. The command invokes the iPerf3 toolkit, that the command should be run for 10 seconds, and that the result should be in Mbps. A typical output is pictured below:
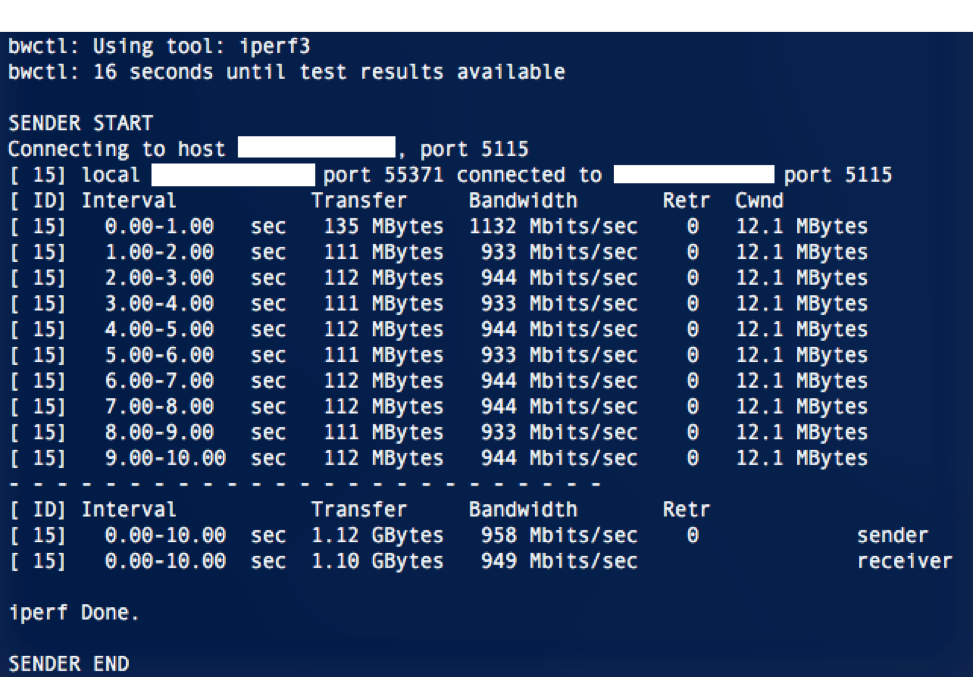
Here you can see that we were consistently able to push an expected level of bandwidth between two 1Gbps test hosts.
Clients regularly ask if the perfSONAR node costs anything to receive and run on their campus. We’re happy to say that, thanks to the assistance of the National Science Foundation’s CC-IIE Grant, we’re able to supply perfSONAR nodes to OARnet clients at no cost. The only things the client must provide are a network connection and power.
If you’re interested in implementing perfSONAR in your network, you can visit the perfSONAR website at perfsonar.net, or contact OARnet’s Performance Engineer, Cody Smith, at cosmith@oar.net.